Quantitative project / Q1
SPY One-Day Dip-Reversion Backtest
A Python backtest examining whether SPY tends to recover during the next trading session after falling more than 2% while remaining above its 200-day moving average.
Python · Pandas · yfinance · Matplotlib · Quantitative research
01
Research question
Do large SPY declines tend to reverse during the next session?
The study identifies trading sessions in which SPY falls more than 2% but remains above its 200-day moving average.
A signal is recorded after the market closes. The simulated trade enters at the following session’s opening price and exits at that session’s closing price.
The 200-day moving average acts as a trend filter, limiting the study to short-term declines occurring while SPY remains within a broader upward trend.
02
Method
Signal, entry, exit, and evaluation.
Download adjusted daily SPY price data.
Calculate daily returns and the 200-day moving average.
Generate a signal when SPY falls more than 2% and closes above its 200-day moving average.
Enter at the next session’s open and exit at its close.
Measure win rate, average return, median return, cumulative trade return, and best and worst trades.
03
Results
Compounded returns across recorded trades.
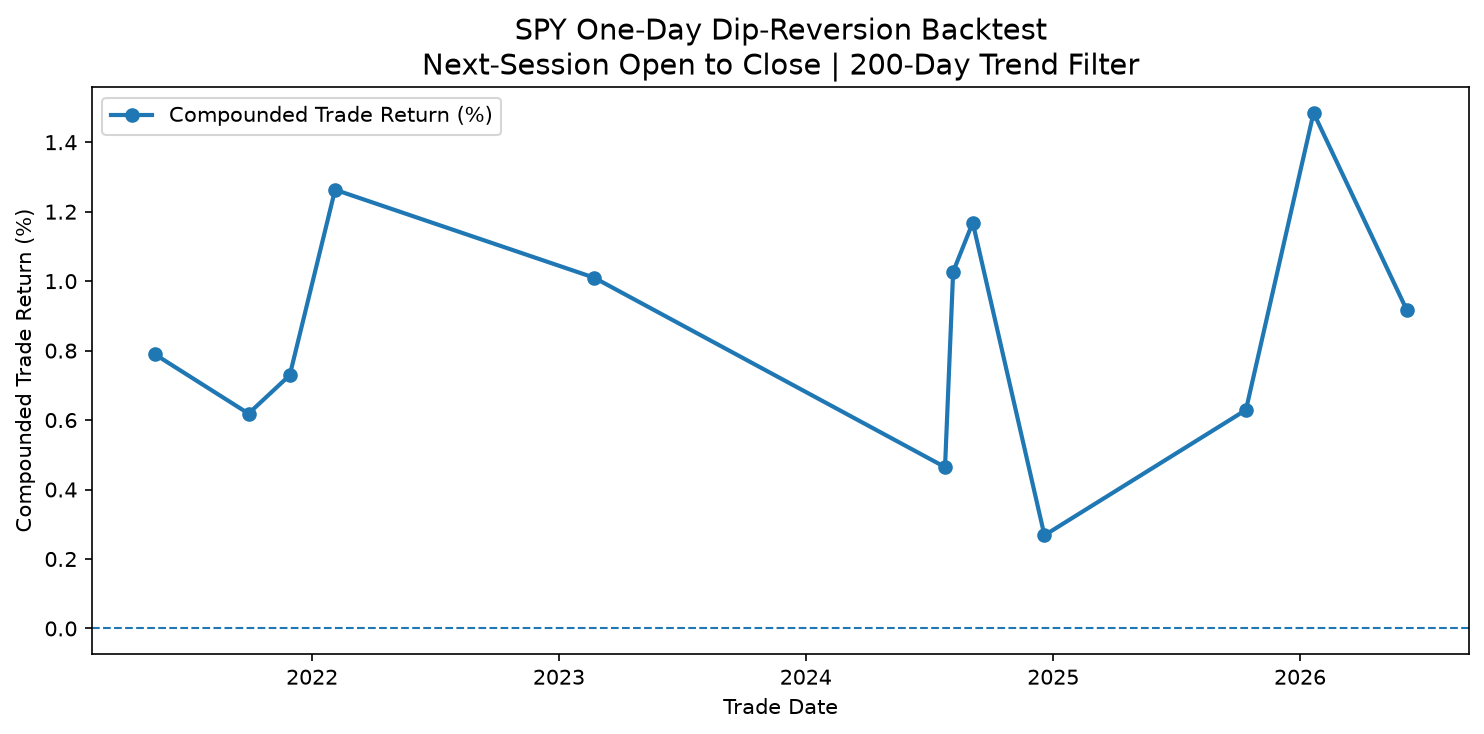
The chart shows the compounded return of the recorded trades. It does not represent continuous investment in SPY or a comparison with a buy-and-hold benchmark.
04
Revision and limitations
What I learned after building the first version.
After completing the initial backtest, I realized that it assumed a trade could be entered at the same closing price used to generate the signal. I revised the methodology so the signal is confirmed at the close, the trade enters at the next session’s open, and exits at that session’s close. This created a more realistic and reproducible study.
The results still exclude commissions, taxes, slippage, execution delays, and other real-world trading constraints. The strict signal conditions also produced a relatively small number of trades, so the results should be treated as an exploratory historical study rather than evidence of a proven trading strategy.
Project files
Explore the study.
The GitHub repository contains the Python backtest, generated chart, trade data, and project documentation.
Open GitHub repository ↗